Welcome to part 2 of the threat hunting with jupyter notebook series, If you followed part 1 you should be setup and able to query MDE in a jupyter notebook using msticpy.
Now lets do the exciting part, lets build some custom queries and use them to investigate a host for suspicious activity and put it all together in a Jupyter notebook. Remember that these queries are designed to be ran on a single endpoint and as such the volume of data will increase exponentially when they are scaled to an entire environment. This does not mean that they will not scale it just depends on the size of your environment, if the queries take to long to run at scale you likely need to automate the data collection part of your hunt or collect a smaller subset of data. The analysis should be fairly similar even when performed at scale, it just may involve more exclusions.
Setting up Custom Support Queries
So to setup our custom queries in msticpy we need to edit our msticpy.yaml file and provide it with the following additional information.
QueryDefinitions:
  Default:
    - "queries"
  Custom:
    - /Users/myhome/Code/mstical_queries
You can read more about custom query definitions and more msticpy configuration steps here
Building Custom Queries
So first lets look at the directory structure for my custom queries.
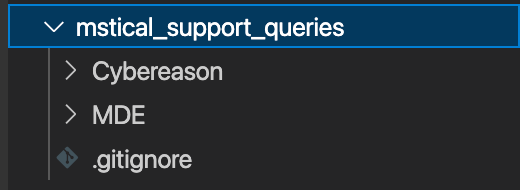
As you can see i have a sub folder which is called MDE this is the folder for all Microsoft defender for endpoint queries. Within that subfolder are multiple yaml files which contain custom queries.
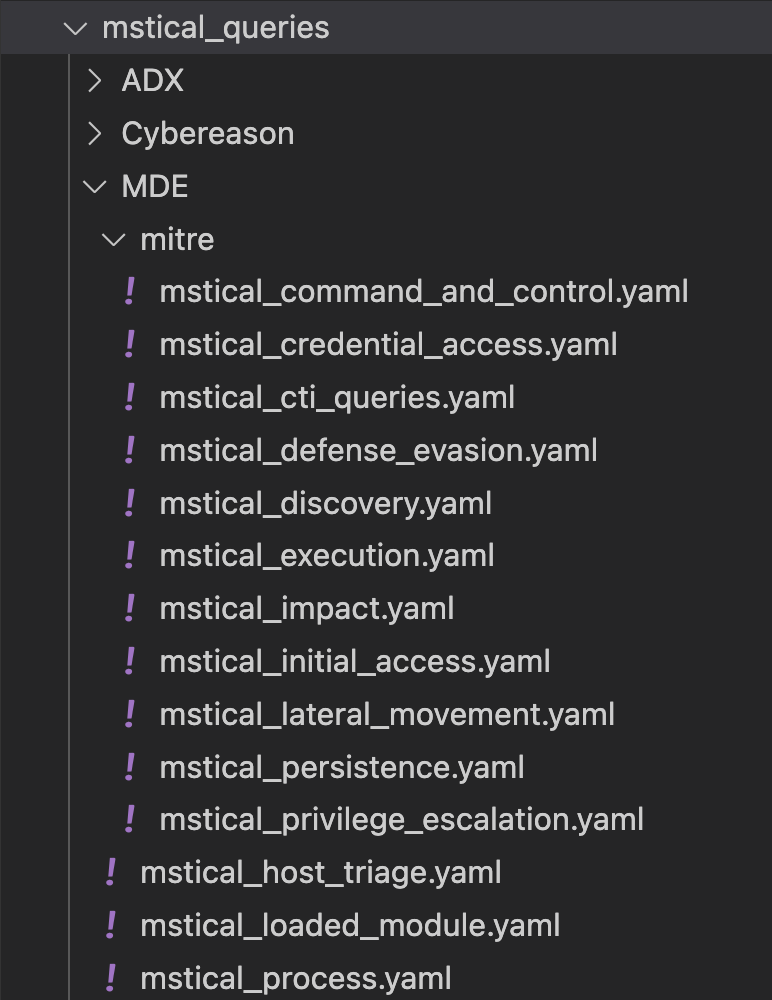
As you can see, specific queries are grouped into mitre, for example there is a query looking for suspicious child processes from office applications called office_applications_suspicious_child stored within the mstical_execution.yaml file. These queries are more basic and designed to provide a small subset of data which you may find worth investigating as you would consider it suspicious. These queries can ideally be ran in an automated way with the data collected daily and turned into automated “hunting leads” for an analyst to investigate as lower fidelity than a traditional SOC alert, with the whitelisting done directly within a notebook or function.
Alternatively an analyst can pick a query for each mitre category when performing ad-hoc hunting, or whatever else they want to do with them.
More “generic” queries are grouped based on the data type requested. For example if you want to request anything to do with processes such as parent process = rundll32.exe you would use the parent_processes_query in process.yaml. These queries are designed to gather a larger dataset to perform more complex investigations, involving machine learning and data science techniques, or build baselines, such as all rundll32 activity or net.exe psexec etc.
If you work at an MSP or have a different EDR and SIEM such as Splunk and MDE you may want to keep your data collection queries as broad as possible using the “generic” queries and do as much of your data analysis in Python/pandas as possible. This is because after some data normalisation your Jupyter notebooks analysis functions will be vendor agnostic meaning your analysis functions can be applied to various EDRs and SIEMS making your notebooks more scalable. You can view my mstical_queries branch here. PRs welcome
I’ve laid out a sample yaml file with query for my MDE process file.
metadata:
  version: 1
  description: MDE Queries around suspicious processes creation events
 metadata:
  version: 1
  description: MDE Queries around suspicious processes creation events
  data_environments: ["MDE","M365D"]
  data_families: ["mstical_process", "MDE"]
  tags: ["mstical_process","process"]
defaults:
  metadata:
    data_source: "hunting_queries"
  parameters:
    table_process:
      description: Table Name
      type: string
      default: DeviceProcessEvents
    table_image:
      description: Table Name
      type: string
      default: DeviceImageLoadEvents
    table_registry:
      description: Table Name
      type: string
      default: DeviceRegistryEvents
    table_device:
      description: Table Name
      type: string
      default: DeviceEvents
    start:
      description: Query start time
      type: datetime
      default: -1
    end:
      description: Query end time
      type: datetime
      default: 0
    add_query_items:
      description: additional query clause e.g project
      type: str
      default: ""
sources:
  processes_query:
    description: process creation events
    metadata:
    args:
      query: |-
        {table_process}
        | where Timestamp >= datetime({start})
        | where Timestamp <= datetime({end})
        | where FileName has_any({processes})
        {add_query_items}
    parameters:
      processes:
        description: Process name
        type: list
Some things you should pay attention to in the file above is the following.
Metadata
The “data_environments” key – the data_environment key states which data providers your queries can be ran againist.
“data_families” key – The data familes key lists what these queries are related to, in our case they are related to rob_process, this will be used when you actually run your query.
Parameters
The “parameters“ keys – These are just Default Parameters that will be available in any query
Sources
The sources key is where you will put your custom queries, as you can see from above i created a query called “processes_query”. This query looks in the DeviceProcessEvents table in the column “FileName” for a list of processes which is supplied by the user as the parameter “processes”
Microsoft have fully documented this here if you need more information.
Putting it all together
This is how you would now call that function in a Jupyter Notebook, providing you connected to msticpy how we did it in part 1.
powershell = mde_prov.mstical_process.processes_query(processes=["powershell.exe"])so here you can see we used our query provider M365D which we specified in part 1, we then specified that we want to use the mstical_process custom queries and then the name of our custom query we created “processes_query”. We then used our parameter “processes” which takes a list of process names to search for, in this case we searched for powershell, we then stored the output of this query in a dataframe called powershell.
The Host Investigation Notebook
So now we know how to develop custom queries and run them, we can develop a Jupyter notebook to aid in performing DFIR on a single host. This notebook aims to use the EDR to gather the basics of a host investigation to help triage a host. It looks for the following host artifacts
- LOLBAS Process execution
- Processes spawned by LOLBAS Processes
- Processes spawned by office applications
- Top 10 Cobalt Strike Spawn To Value Processes
- Interpreter activity [powershell, cmd]
- recon processes, [net, nltest]
- Suspicious Loaded Modules
- ASEP Keys
- Scheduled Tasks
- Services
- Process Injection
- Named Pipes
- Process execution in commonly abused malware Paths
I’m Always open to PRs to add additional queries and triage, see here.
You can also use some of the queries within this notebook to be executed automatically to enrich traditional SOC alerts, to save the analyst manually running those queries when gathering information on a host.
So lets start with the imports and connection cells
import pandas as pd
import msticpy as mp

from bokeh.io import output_notebook
output_notebook()

mp.init_notebook()
pd.options.display.width = 0
pd.options.display.max_columns = 0
mde_prov = mp.QueryProvider("M365D")
mde_prov.connect()
LOLBAS Investigation
Ok now we’re connected we need to create a couple of lists to make our life easier, like a list of LOLBAS and RECON processes. Ideally this would be in a custom python package along with more advanced analysis functions like defining what “suspicious” is in an automated way, but i’ll leave that as an exercise for the reader as i’d get in trouble if i shared mine. For this sample notebook the lists will be enough. You should note that i am not going to say what malicious activity looks like in your environment, that should be done to you, however i will show some examples of what malicious activity looks like, this is also something that could be added to that custom python package. In general the following things should be considered suspicious
- weird parent child process relationships, e.g rundll32.exe spawning net, cmd or powershell etc
- Obfuscation characters present in the commandline
- weird intepreter commandlines
- User writable paths should be looked at closely
- processes execution for rare/unusual executable file types
however in the notebook each section has a list of warning flags. It is a broad list to start off with however as your maturity levels increase it becomes much easier to meet the requirements.
so lets start with the basics, defining a list.
LOLBAS = ["add","lolbas","processes","here"]Now we have the list we can use it in our query like this
lolbas = mde_prov.mstical_host_triage.host_processes_query(start="-7", hostname="sus_host", processes=LOLBAS)This will take some time to complete depending on how big your environment is, but since its for a single host in the past week the volume should be fairly low, i got around 7000 results on a loud host in the past week.

so now lets see what has been executed by running something basic like
lolbas["FileName"].unique()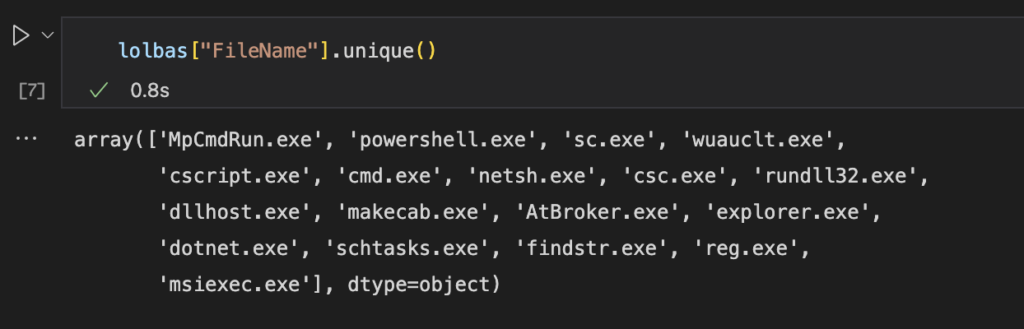
Ok so now we know what specific LOLBAS process execution has occured on the host.
So lets see an example of how to investigate a specific LOLBAS and group the information to make it more readable.
lolbas[lolbas["FileName"].str.contains("cmd")].groupby(["InitiatingProcessFileName", "FileName"]).agg(ProcessCommandLine=("ProcessCommandLine", set), count=("ProcessCommandLine", "count"))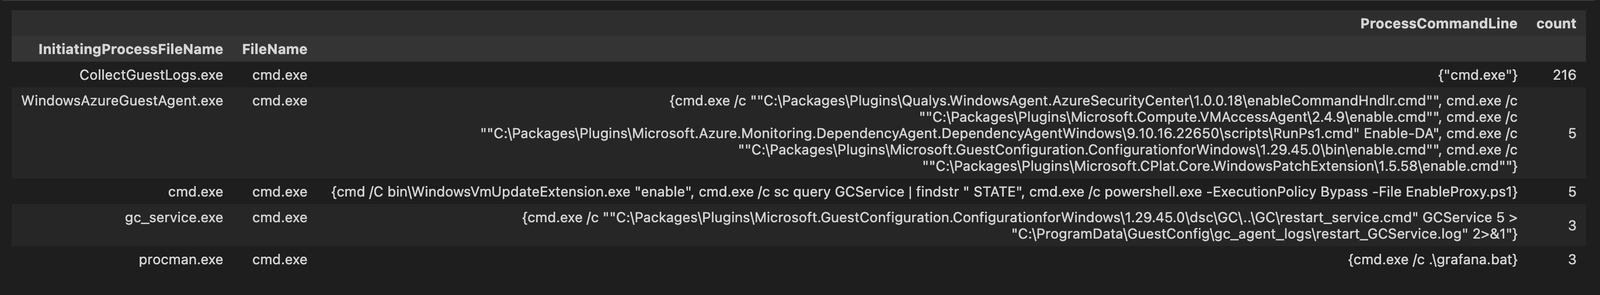
We can also expand this view to all LOLBAS processes that have executed on that host by doing something like the below.
lolbas.groupby(["InitiatingProcessFileName", "FileName"]).agg(ProcessCommandLine=("ProcessCommandLine", set), count=("ProcessCommandLine", "count"))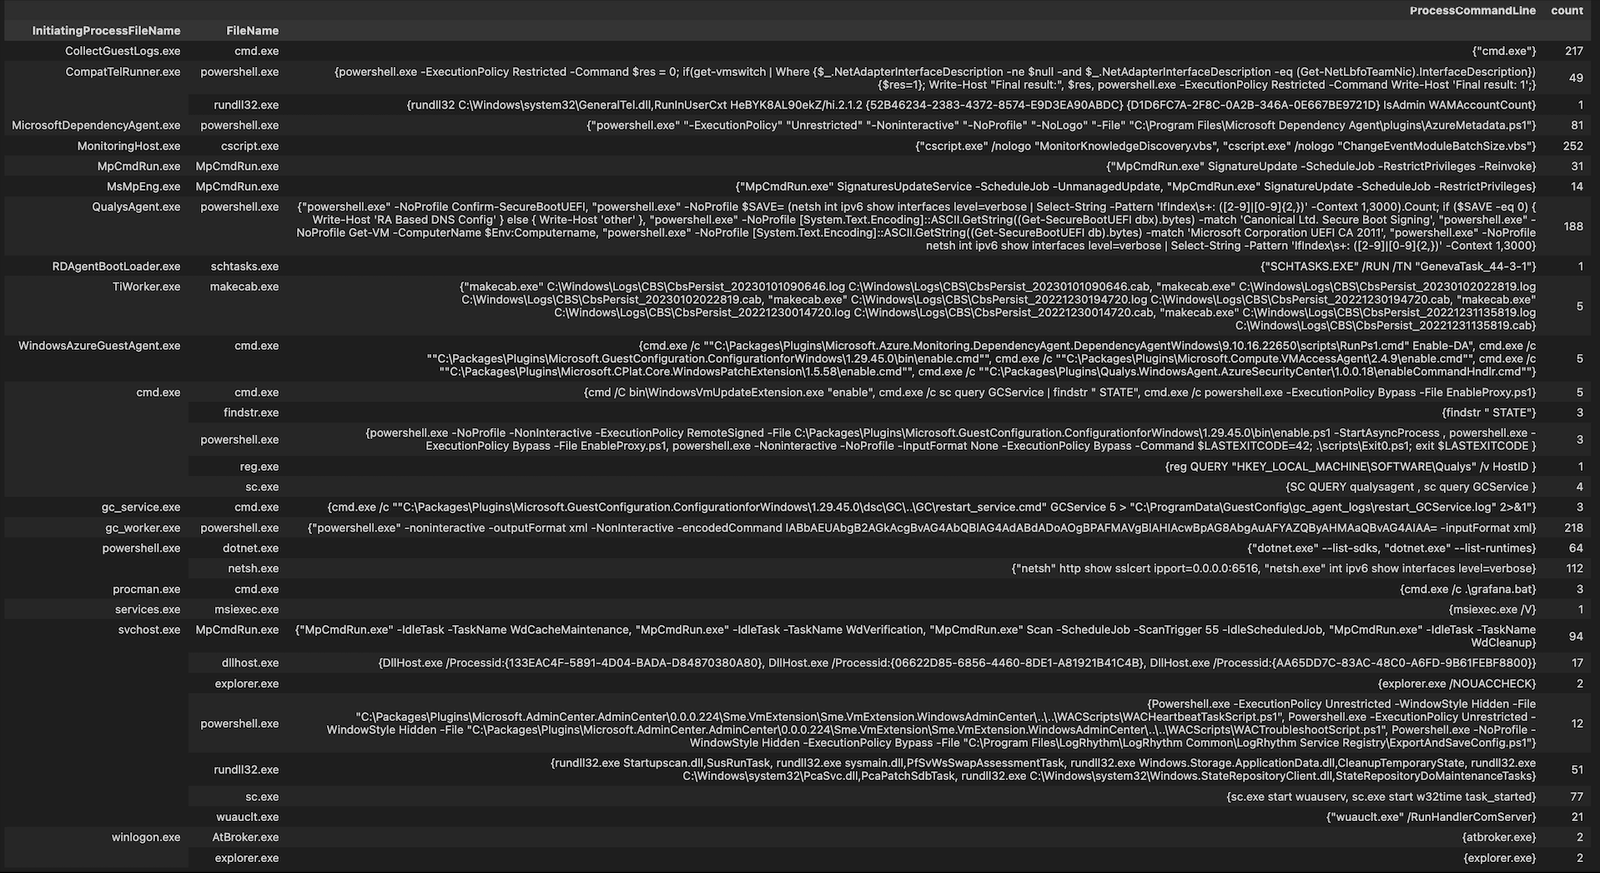
you may want to exclude some known good commandlines to do this you can do something like below
cmd_lines = [
"known_good1",
"known_good2",
"known_good3"
]
cmd_lines = [f"(?:{cmd_line})" for cmd_line in map(str, cmd_lines)]
search_pattern = "|".join(cmd_lines)

lolbas_exclude = lolbas[~lolbas["ProcessCommandLine"].str.contains(search_pattern)]
lolbas_exclude.groupby(["InitiatingProcessFileName", "FileName"]).agg(ProcessCommandLine=("ProcessCommandLine", set), count=("ProcessCommandLine", "count"))
This output is designed to use the groupby to present the data in a way that an experienced analyst can go through and highlight anomalous or malicious activity. Once they have done this once they could then turn this analysis into a reusable function. For example we know attackers commonly use rundll32 in attacks. So we could do something like the below to create a function to detect suspicious rundll32 activity.
def suspicious_lolbas_rundll32_execution(
dataframe: pd.DataFrame,
process_column: str = "FileName",
process_name: str = "rundll32.exe",
command_line_column: str = "ProcessCommandLine",
suspicious_params: List[str] = [
"appdata"
".scr",
"advpack.dll",
"cmd",
"Control_RunDLL",
"comsvcs",
"cscript",
"desk.cpl",
"dfshim.dll",
"FileProtocolHandler",
"ieadvpack.dll",
"ieframe.dll",
"InstallHinfSection",
"javascript:",
"LaunchApplication",
"LaunchINFSection",
"mshtml.dll",
"OpenURL",
"pcwutl.dll",
"powershell",
"PrintHTML",
"RegisterOCX",
"RegisterXLL",
"RegisterXL",
"RouteTheCall",
"setupapi.dll",
"setupInfObjectInstallAction",
"shdocvw.dll",
"shell32.dll",
"ShellExec_RunDLL",
"ShOpenVerbApplication",
"ShOpenVerbShortcut",
"syssetup.dll",
"temp"
"url.dll",
"users",
"wscript",
"zipfldr.dll",
],
**kwargs,
) -> pd.DataFrame:
"""Filter on processes that contain a suspicious file name."""
del kwargs
return dataframe[
(dataframe[process_column].str.casefold() == process_name.casefold())
& dataframe[command_line_column].str.contains("|".join(suspicious_params))
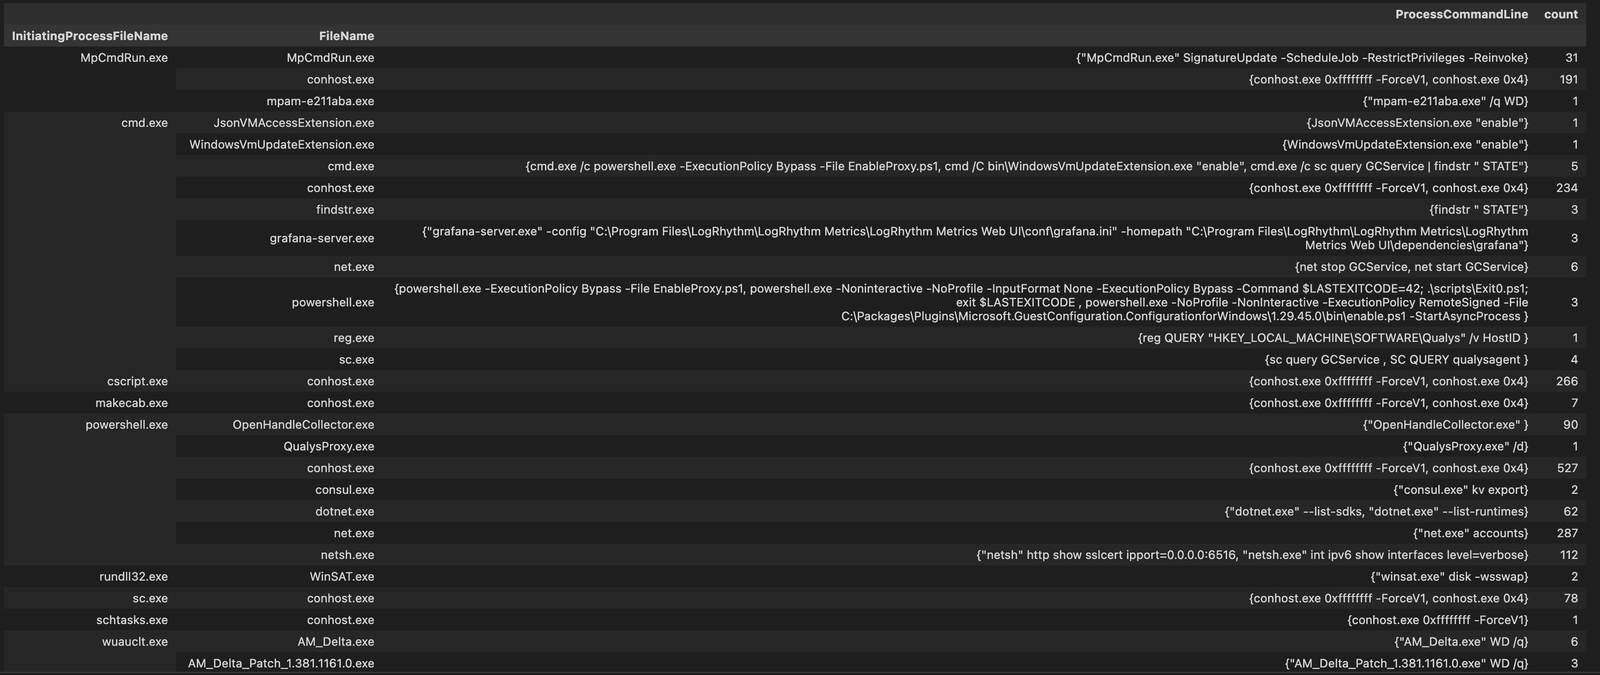
]Then you can just call that one function to highlight all rundll32 activity you may find interesting.
suspicious_lolbas_rundll32_execution(lolbas).groupby(["InitiatingProcessFileName", "FileName"]).agg(ProcessCommandLine=("ProcessCommandLine", set), count=("ProcessCommandLine", "count"))I’ve found the introduction of functions makes the notebook much easier to read but also more scalable. This is due to placing the functions in a custom package, which can be imported in every notebook. This makes it easy to run and update the functions used in all notebooks. You may find that many of your functions will be used in multiple notebooks. You can also run a large amount of functions at once, meaning that you can easily highlight all suspicious activity by running a list of pre-built functions.
For example the basic function above could be expanded further to include all LOLBAS processes to automatically highlight LOLBAS activity worth looking at. You should split each LOLBAS into a seperate Python file e.g rundll32.py. It’s likely you will end up with multiple fuctions per lolbas inside that python file since some activity is more suspicious than others. The function i shared above does not include user writable paths or obfuscation characters, however it is likely something you would be interested in. You could even add in exclusions specific to your environment into these functions, meaning you could easily detect deviations.
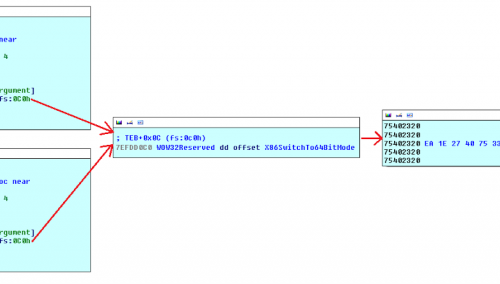
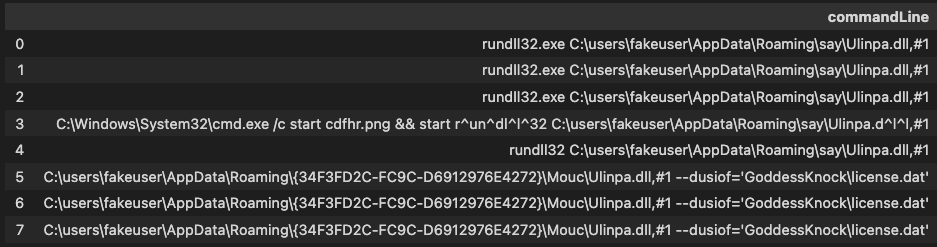
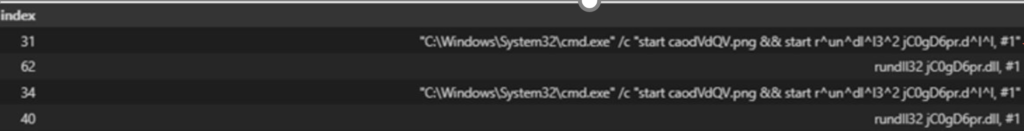
Here is an example of a real world icedid intrusion, as you can see there is various suspicious indiactors such as a png file in the commandline, along with the obfuscation characters and finally the license.dat string, known to be linked to malware.›
Processes Spawned By LOLBAS Processes
Now lets look at processes spawned by lolbas processes, this can be a good way to spot suspicious activity, so first lets run the cell to get the data
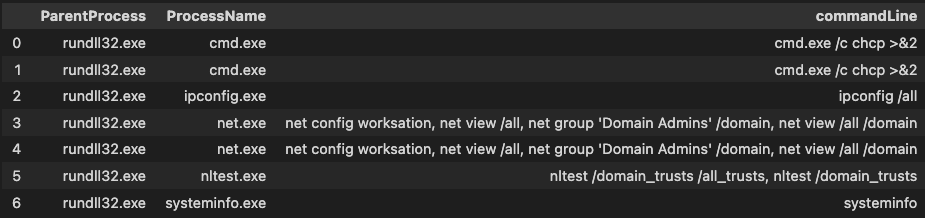
lolbas_parent = mde_prov.mstical_host_triage.host_parent_processes_query(start="-7", parent_processes=LOLBAS, hostname="sus_host")then group it like we did previously, as you can see here, its much easier to go through this output to identify what you would consider suspicious activity.
Here is an Example of some real world poor threat actor oppsec using rundll32 as the default child process spawning net and nltest which was not alerted on by an EDR vendor 🙁
Process Spawned By Office Applications
As i’m sure you know, office applications can often be used in phishing attackers, it isn’t hugely uncommon to see a child process being spawned from these documents, so lets search for it.
office_child_process = mde_prov.mstical_host_triage.host_parent_processes_query(start="-7", parent_processes=OFFICE, hostname="sus_host)Cobalt Strike Default Spawn-To Values
Now lets look for the top 10 coablt strike spawn to processes, it is common to observe these processes being used by commodity malware and lower level threat actors to spawn child processes, for example if you see rundll32 spawning the cmd with the commandline ‘net group “Domain Admins” /domain’ you’re probably going to have a bad time. As observed in the real world intrusion above.
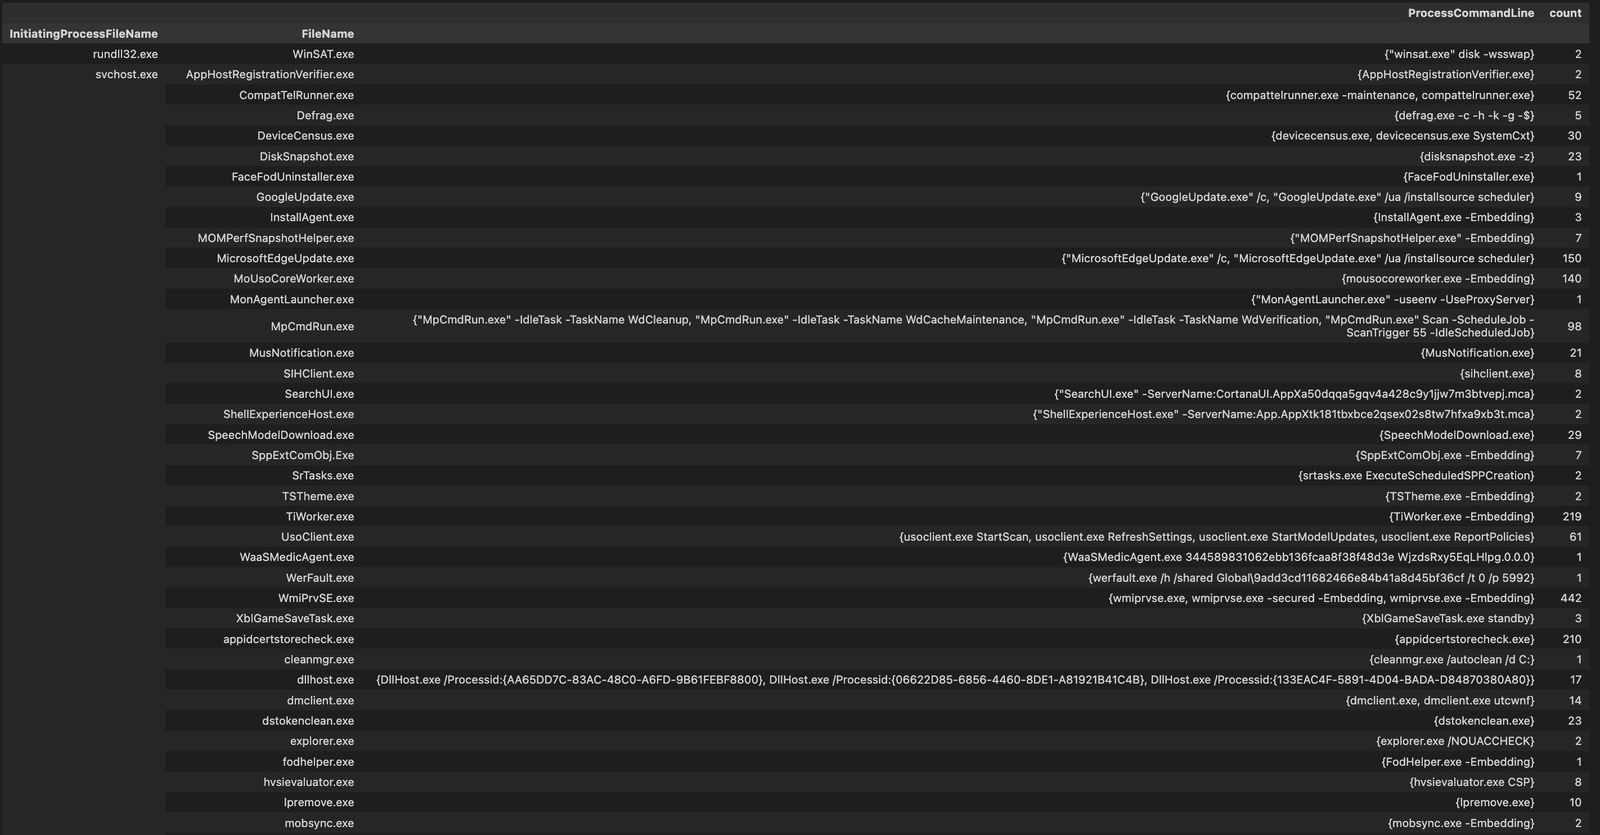
cs_spawn_to = mde_prov.mstical_host_triage.host_parent_processes_query(start="-7", parent_processes=CS_SPAWN_TO, hostname="sus_host)This data is fairly low volume, apart from the obvious such as svchost. Using the same groupby as before makes this data manageable.
Common Interpreters
We can look for common interpeters by running something like
common_interpreter = mde_prov.mstical_host_triage.host_processes_query(start="-7", processes=["powershell", "cmd.exe", "wscript.exe", "cscript.exe"], hostname="sus_host")Then to view all the unique commandlines for a process we could do something like below.
common_interpreter[common_interpreter["ProcessCommandLine"].str.contains("cscript")]["ProcessCommandLine"].unique()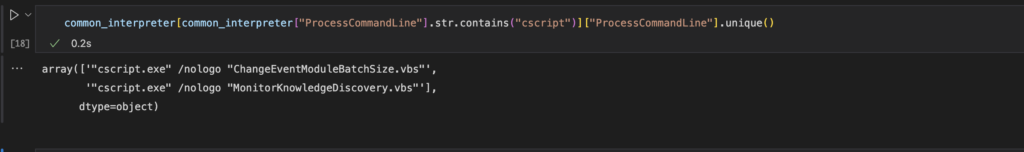
We can also use the groupby with some exclusions
cmd_lines = ["SenseIR","gc_worker"]
cmd_lines = [f"(?:{cmd_line})" for cmd_line in map(str, cmd_lines)]
search_pattern = "|".join(cmd_lines)

common_interpreter_exclude = common_interpreter[~common_interpreter["InitiatingProcessFileName"].str.contains(search_pattern)]
common_interpreter_exclude.groupby(["InitiatingProcessFileName", "FileName"]).agg(ProcessCommandLine=("ProcessCommandLine", set), count=("ProcessCommandLine", "count"))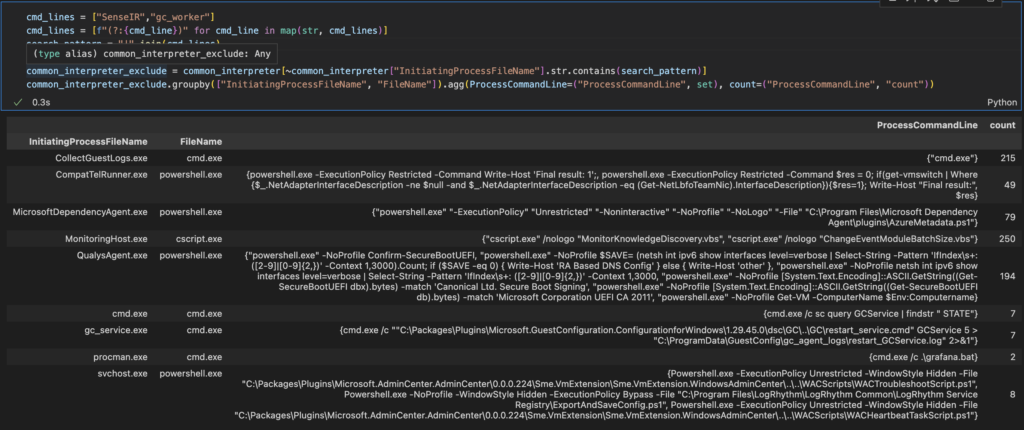
We know attackers use obfuscation characters frequently when attempting to bypass AMSI and generic commandline montioring. They typically only use a few characters, we can look for those with something like.
cmd_lines_obfuscation = cmd_lines[cmd_lines["ProcessCommandLine"].str.contains("|".join(CHARACTERS))].groupby(["InitiatingProcessFileName", "FileName"]).agg(ProcessCommandLine=("ProcessCommandLine", set), count=("ProcessCommandLine", "count"))
cmd_lines_obfuscation
Here is another real world example of icedID using commandline obfuscation in a intrusion.
Recon Processes
Attackers typically use commandline tools like wmic, net nltest etc for post exploitation recon activity, lets look for it.
recon = mde_prov.mstical_host_triage.host_processes_query(start="-7", processes=RECOON, hostname="sus_host")A Simple groupby shows that this is a quick and easy way to spot suspicious recon activity on a host.
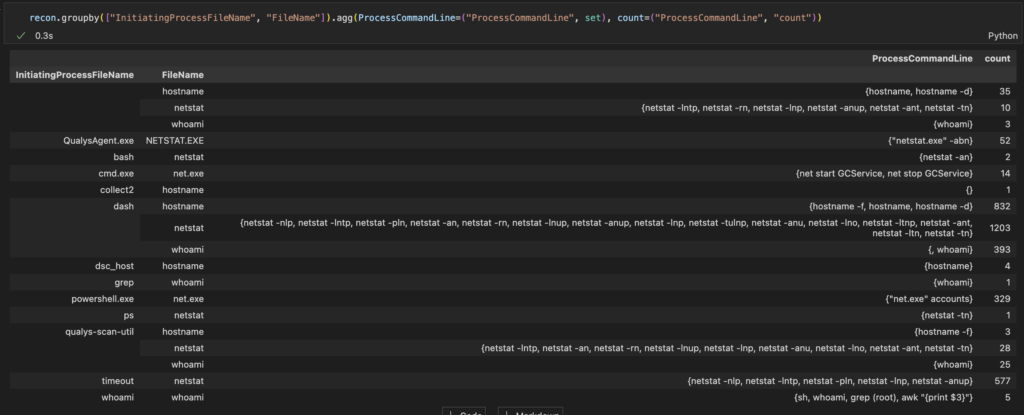
You could also group this data to look for more than X amount of these recon processes executed on a single host or by a single user within 1 day, since threat actors typically run them all within a short duration of time. Although i’m sure you have an alert for this already right!?
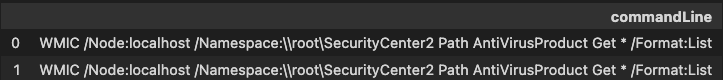
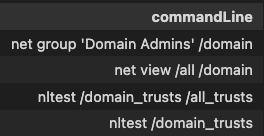
To make things easier here some examples of what a malicious wmic and net.exe commandline might look like.
Suspicious Image Loads -system.management.automation.dll
Since we know it’s possible for threat actors to run powershell without spawning powershell.exe by using the system.management.automation.dll see here.
We can look for threat actors attempting to utilse this method by looking at what processes are loading the system.management.automation DLL.
powershell_module_load = mde_prov.mstical_host_triage.host_image_load_query(start="-7", loaded_image=["system.management.automation.dll"], hostname="sus_host")Then to view the list of unique processes loading that DLL we can do.
powershell_module_load["InitiatingProcessFileName"].unique()We can then look for anomalies within the outputted dataframe such as system.management.automation being loaded by an unusual process.
We can also apply this logic for other DLLs but since the logic is the same i won’t go over it again i will just list the DLLs here.
- system.management.automation.dll
- clr.dll
taskschd.dll- [wmiutils.dll, fastprox.dll]
- winhttp.dll
- [Microsoft.WSMan.Management.ni.dll, WsmSvc.dll, WsmAuto.dll]
- netapi32.dll
To see the full analysis see the Jupyter notebook.
Auto Start Entry Points
Now we’ve looked for suspicious loaded modules lets move into looking for changes made to ASEP keys. This is typically done by an attacker to obtain persistence.
asep_keys = mde_prov.mstical_host_triage.host_asep_registry_key_set_query(start="-7",hostname="sus_host")For the full list of warning flags see the Jupyter notebook.
Scheduled Tasks
We can also look for scheduled tasks created on the host by doing following
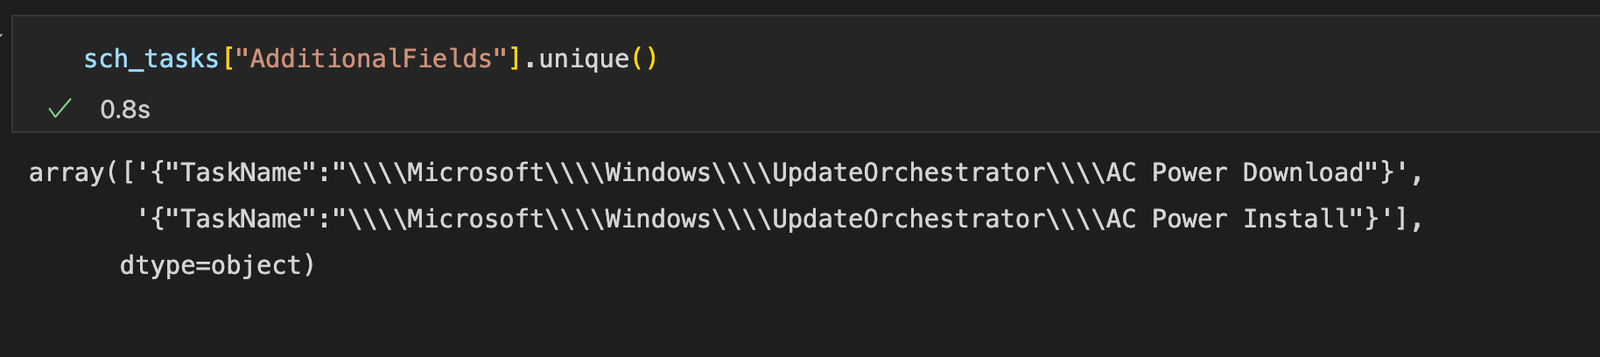
sch_tasks = mde_prov.mstical_host_triage.host_scheduled_task_creation_query(start="-7", hostname="sus_host")then we can easily view the list of unique scheduled tasks created on the host by something as simple as
Services
We can collect services with the following query.
services = mde_prov.mstical_host.host_get_services_query(start="-7", hostname="")For the full list of warning flags see the Jupyter notebook.
Process Injection
Process injection is a difficult detection owing to how often it seems to appear legitimately in windows environments, especially the older ones. So there could be a large volume of alerts depending on your environment, i recommend learning normal and then excluding it. Or using it as a low level indicator and combining it with other factors to trigger an investigation.
process_injection = mde_prov.mstical_host_triage.host_process_injection_api_calls_query(start="-7", hostname="sus_host")here is an example of how to detect suspicious process injection.
sus_process_injections = CS_SPAWN_TO + ["winword","excel","powerpnt","outlook"]
sus_process_injection = [f"(?:{sus_process_injection})" for sus_process_injection in map(str, sus_process_injections)]
search_pattern = "|".join(sus_process_injections)

process_injection_exclude = process_injection[process_injection["FileName"].str.contains(search_pattern)]

process_injection_exclude.groupby(["InitiatingProcessFileName", "FileName"]).agg(ProcessCommandLine=("ProcessCommandLine", set), count=("ProcessCommandLine", "count"))
if you wanted to make this more usable like being easily applied in multiple notebooks you could turn it into a function with something like
def suspicious_process_injection(
    dataframe: pd.DataFrame,
    filename_column: str = "FileName",
    suspicious_param: list[str] = CS_SPAWN_TO + ["winword","excel","powerpnt","outlook",],
    **kwargs,
) -> pd.DataFrame:
        """Filter on Suspicious Processes Conducting Process Injection"""
        del kwargs
        return dataframe[
            dataframe[filename_column].str.contains("|".join(sus_process_injection))
        ]
run that cell then you can easily call this function in the future by running
suspicious_process_injection(process_injection)Named Pipes
Various C2 frameworks used by threat actors often have defaults setup for named pipes, not all threat actors will change the name of these pipes due to there typically not being a need to. So lets look for these defaults.
named_pipes = mde_prov.mstical_host_triage.host_malicious_named_pipes_query(start="-7", hostname="sus_host")Common Malware Process Execution Folders
Malware typically executes from common directorys like C:\Users\* or %TEMP% etc so lets look for that. An Ideal list would be a list of all user writable paths on the organisations windows build. We could get that by downloading sysinternals accesschk. Then running accesschk64.exe -uwdqs YOURUSERNAME C:\* > userwritepaths.txt
I havent done that here. This list just includes stuff like %users%, %appdata%, %temp% and %perflogs%.
uw_path = mde_prov.mstical_host.host_process_execution_from_path_query(start="-7", file_path=COMMON_MALWARE_PATHS, hostname="")Then we can easily group and look at all the filenames with the following groupby.
uw_path.groupby(["FileName", "FolderPath"]).agg(ProcessCommandLine=("ProcessCommandLine", set), count=("ProcessCommandLine", "count"))Conclusion
So thats it, you made it to the end of the post. Hopefully you found it useful and now have an idea of how Jupyter notebooks can be used to investigate a host and how some of these queries could scale for your organisation to detect malicious activity. I see these queries and notebook being used in the following way
- Easy way for an analyst to automate the investigation of a single host adhoc for context and making sure everyone completes the same “checklist”
- Run from a traditional alert to enrich the ticket with additional information.
- Use it as a starting point to scale up to run these queries at scale accross all assets. starting from LOLBAS and suspicious parent-child process relationships
We’ve also observed automation is especially important in threat hunting due to the nature of threat hunting. We have a lower signal to noise ratio so we need to automate and baseline as much as possible so that analysts can investigate lower fidelity detections effectively and catch threats that bypass existing security controls.
You can access the full Jupyter notebook here.
I’ve also pubished all the queries for this notebook, along with many others in my repo mstical_queries.